


Mapping a Displaced Population
Courtesy of Peter Hansen
By Peter Hansen, GIS specialist, Department of Geography and Planning
Editor’s Note: As we approach the one-year anniversary of the Camp Fire, we are honoring its impact on our community with a series of stories embracing the themes of remembrance, recovery, and resurgence.
I spent much of the morning of November 8, 2018, watching the Camp Fire from the seventh floor of Butte Hall. As I watched the constant stream of headlights pour out of our Butte County foothills, I wondered where all of these 50,000 evacuees would go while the fire was active. And as we learned of the extent of the damage (more than 18,800 structures lost), I wondered where they would take their lives next.
Over the last year, I have worked with geography and planning professors Jacque Chase and LaDona Knigge along with economics department chair Pete Tsournos and the University’s GeoPlace Mapping Lab to examine the how, why, and where survivors have gone. In studying the fire’s displacement effect, we hope to give demographic context to where people have relocated, recognize trends in who has left Butte County and who stayed behind, and help identify policy and planning considerations to adjust to these population fluctuations.
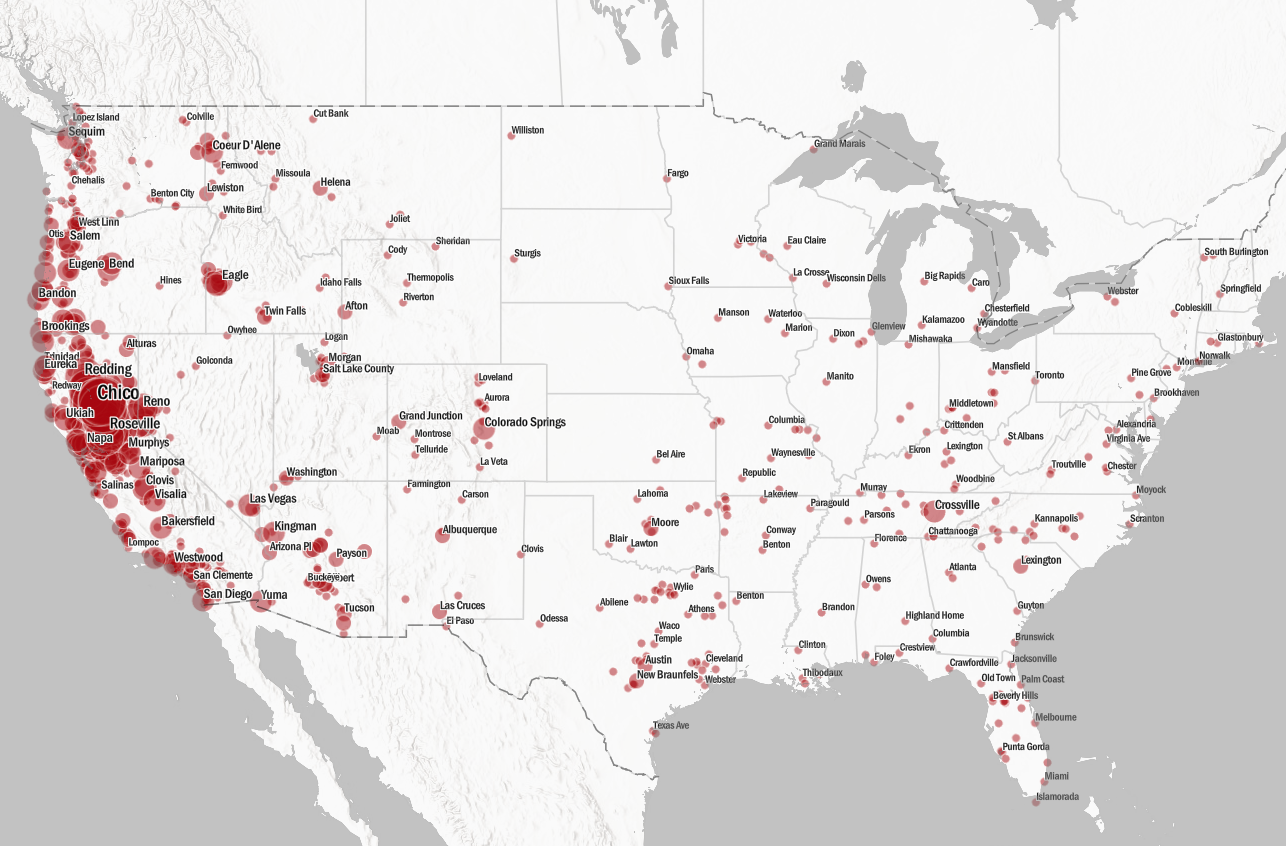
The University’s GeoPlace Mapping Lab produced a US map showing the new addresses of Camp Fire survivors as they scattered across the country.
The College of Behavioral and Social Sciences supported this effort by funding a data purchase so we could acquire more insightful information than basic parcel data. Using mailing lists for all Butte County residents from October 2018, we first geocoded the data to see that the mailing address of 37,198 adult-aged individuals fell within the Camp Fire footprint. We used that data to do our first USPS permanent change of address query in April 2019 and returned 11,957 new mailing addresses. By September, there were 13,153 new mailing addresses.
These maps depict only a portion of Camp Fire survivors—roughly one-third of the affected population—but I think the value in these demographic findings is the granularity and precision of the locations.
A map of the Camp Fire burn area shows the new addresses of former residents, revealing where people moved after the fire.
A lot of public governmental reports deal in aggregates and without much depth—quantity by state or county for example—but they do not always provide context to the populations that went there or where specifically they went. Are the new addresses in an another high fire hazard area? In a floodplain or hurricane-prone area? What were the economic and social characteristics of the affected population? It also helps on a local level to know who remains.
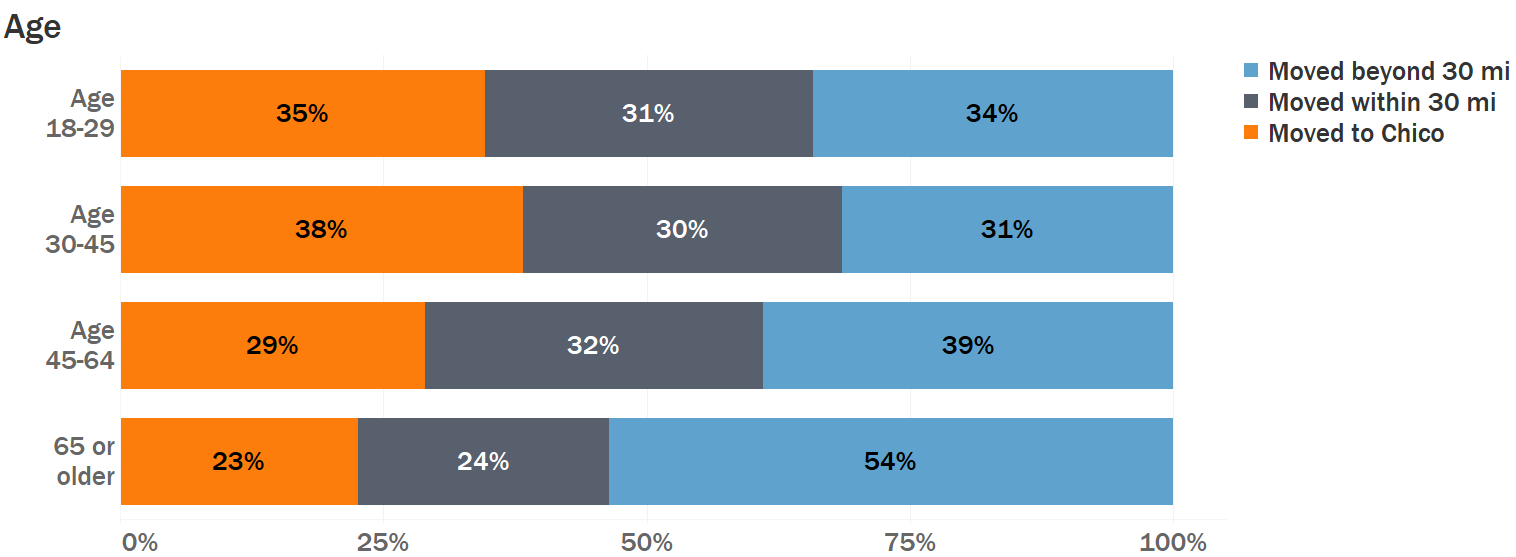
For instance, in looking at a comparison based on ages, half of the over-65 group for whom we have new addresses have left the area. Will that mean Paradise and the Ridge will no longer be an enclave for our senior populations? Does that change how and what we rebuild? Where did our working-age families go?
We were also able to compare owner-renter status. Of the owner group, we have “permanent” changes of address for about 45 percent. We only have new permanent addresses for 17 percent of the renter group. If you take that ability to “permanently” relocate as a proxy for capacity and capability, renters have not shown the same ability to recover. Insurance plays a role, and the maximum benefit is drastically different for these two groups.
Those findings are supported by some recent data work I did for Butte 211, which provided an intake form several weeks ago to survivors still needing assistance. Of roughly 2,000 entries, nearly 75% identified as renters. They also identified as still requiring some very basic assistance (shelter, food, money), and many still don’t have any case management at the time of filling in the form.
The maps and graphs I’m providing only speak to one-third of the Camp Fire population. Where are the other two-thirds? This data does not speak to the folks on the fringe that are still in disarray and need help.
We know disasters can affect different populations disproportionately, and the kind of work we’re doing can aid in researching and confirming those outcomes. This is important as we experience more catastrophic events resulting in mass displacement, both domestically and globally.
Our deep dive into this data is far from over. I hope that with our own research at Chico State and partnering with other community entities, we can continue to examine the lasting impacts of the Camp Fire and support planning decisions for our region and any other communities who experience such devastation.
Downloadable static maps are available.
Author’s note: This data is not comprehensive of all Camp Fire survivors and does not represent any official count. Data sources include: InfoGroup (Butte County consumer mailing list – October 2018) and USPS NCOALink (accessed September 2019).
Peter Hansen (Geography, ’06; MA, Geography, ’12) is an IT consultant and GIS specialist within the Department of Geography and Planning and the College of Behavioral and Social Sciences. He has been working with maps and spatial data for the last 13 years, and also serves on the Butte County Planning Commission.